
Analysis of Profitability: A 2026 Guide for Freelancers
A designer lands three projects in the same month, works sixty-hour weeks, and expects the bank balance to finally move. Instead, the balance stays almost flat. Software renewals arrive, a subcontractor needs paying, two clients haven't settled their invoices, and extra revisions consume the time that the original quote never covered.
That situation is common because revenue measures activity, not success. A busy month can hide scope creep, direct delivery costs, unpaid invoices, underpriced retainers, and administrative work that nobody records. An analysis of profitability makes those leaks visible by connecting revenue with the time, cash, and resources required to earn it.

Table of Contents
- Why Busy Months Can Still Feel Unprofitable
- The Core Metrics Behind Profitability Analysis
- Going Beyond Overall Margins With Client and Deal Profitability
- A Step-by-Step Workflow to Run Profitability Analysis Each Month
- Sample Calculations for Freelancers and Small Agencies
- How Micro CRM Helps You Collect the Data for Profitability Analysis
- Your 30-Day Profitability Analysis Plan and Next Steps
Why Busy Months Can Still Feel Unprofitable
The designer's three projects produced plenty of invoiced revenue. On paper, the month looked strong. But one project required repeated calls and revisions, another needed a specialist illustrator, and the third client paid late. The designer was busy delivering work, yet part of that work generated little or no return after costs.
This is the difference between gross revenue and usable profit. Revenue is the money charged or invoiced. Profit is what remains after the costs of producing the work and running the business. If you treat every invoiced dollar as available income, you can accept more work while making less progress.
A retainer can create the same illusion. Suppose a client pays a fixed monthly fee, but the agreement gradually expands to include urgent messages, extra meetings, and unplanned deliverables. The fee hasn't changed, but the hours required to serve the account have. Your revenue remains stable while your effective return falls.
Practical rule: A client isn't automatically profitable because the client pays on time or contributes a large share of revenue. Measure what the relationship costs to deliver.
Start with three questions at the end of each month:
- What did each client pay or get invoiced? Separate actual billed revenue from promised future work.
- How much time and cash did each engagement consume? Include delivery, communication, revisions, subcontractors, and project-specific tools.
- What decision follows from the result? Reprice, narrow the scope, improve the process, or stop pursuing similar work.
Profitability analysis turns a vague feeling of financial pressure into an operating habit. Instead of asking whether you're busy, you can ask whether your work is producing enough return for the time and money invested. That shift helps you protect cash, choose better clients, and make hard work visible in the bank account.
The Core Metrics Behind Profitability Analysis
Profitability is the amount left after the costs required to earn revenue. You don't need a complicated finance department to monitor it. A freelancer can build a small monthly dashboard with five metrics and use each one to guide a practical decision.
Start with margins
Gross margin shows what remains after direct delivery costs.
Gross margin = (Revenue − Direct costs) ÷ Revenue
For a photographer, direct costs might include editing help, prints, travel for a specific shoot, and image-delivery fees. A low gross margin suggests that the service price or delivery method needs attention.
Net margin includes the broader costs of operating the business.
Net margin = Net profit ÷ Revenue
It answers a different question: after software subscriptions, rent, insurance, marketing, administration, and other operating expenses, how much revenue remains? If gross margin looks healthy but net margin is weak, challenge fixed costs before chasing more sales.
Contribution margin focuses on what a sale contributes toward fixed costs and profit.
Contribution margin = (Revenue − Variable costs) ÷ Revenue
This helps when deciding whether to accept an additional project. If a project covers its variable delivery costs and contributes cash toward recurring expenses, it may be useful even when the overall company margin is under pressure. You still need to check capacity and opportunity cost.
Add return metrics
Return on assets, or ROA, measures profit relative to the assets used by the business.
ROA = Net income ÷ Total assets
A small agency with expensive equipment, vehicles, or infrastructure can use ROA to ask whether those assets are producing enough profit. A freelancer with few business assets may find the metric less decisive, but it still reveals whether purchased equipment sits idle.
Return on equity, or ROE, measures profit relative to the owner's invested equity.
ROE = Net income ÷ Shareholders' equity
It translates profit into a return on the owner's capital. ROE has deep roots in ratio-based financial analysis. The DuPont framework, developed at DuPont by Donaldson Brown, breaks ROE into margin, turnover, and financial structure, helping analysts understand whether returns come from stronger pricing, more productive assets, or borrowing. This history of profitability ratios explains that development and the broader role of these measures.
| Metric | Formula | What It Tells You |
|---|---|---|
| Gross margin | (Revenue − direct costs) ÷ revenue | Whether the service price covers direct delivery |
| Net margin | Net profit ÷ revenue | Whether the whole business keeps enough money |
| Contribution margin | (Revenue − variable costs) ÷ revenue | Whether a sale helps cover fixed costs |
| ROA | Net income ÷ total assets | Whether business assets are productive |
| ROE | Net income ÷ shareholders' equity | Whether owner-invested capital earns a return |
A useful benchmark must have context. The median ROE for publicly traded U.S. companies between 1963 and 1999 was 12.2%, according to AAII's discussion of profitable companies and ROE. That historical market reference isn't a target for every freelancer. It demonstrates why analysts compare ratios with relevant norms instead of judging one earnings figure in isolation.
For a monthly review, record revenue, direct costs, net profit, total assets, and owner equity. Then attach one decision to each weak metric. Don't let the dashboard become a report that nobody uses.
Learn how net sales and revenue differ before you build the revenue line in your dashboard.
Going Beyond Overall Margins With Client and Deal Profitability
A company-wide margin is an average. Averages are useful for checking the health of the whole business, but they can hide a profitable client subsidizing a demanding one. A service business needs a second view that follows the money down to the client, deal, and service line.
Per-client profitability starts with the revenue associated with one relationship, then subtracts the costs of serving that relationship. Include delivery time, meetings, revisions, support, subcontractors, travel, and tools purchased specifically for that client. If you only subtract invoices from supplier bills, you miss the cost of your own capacity.
Per-deal profitability uses the same logic for a project or opportunity. A fixed-fee website project may look attractive at the proposal stage, yet become weak after additional workshops and correction rounds. Compare the agreed value with the hours used, not the hours you hoped to use.
Per-service profitability groups similar work together. A consultant might discover that strategy workshops produce strong returns, while custom reporting consumes more preparation time than the price reflects. The blended margin can remain acceptable while the service mix deteriorates.
| Client or Deal | Revenue | Direct Costs | Time Cost | Net Margin % |
|---|---|---|---|---|
| Client A, brand project | $4,000 | $500 | $1,200 | 57.5% |
| Client B, monthly retainer | $3,000 | $200 | $2,000 | 26.7% |
| Deal C, urgent campaign | $2,500 | $600 | $1,700 | 8.0% |
The figures in this table are illustrative, not a benchmark. They show the calculation pattern. Time cost can be estimated by multiplying hours worked by a realistic internal hourly cost. For an owner, that cost should reflect the income the business needs to provide, plus relevant operating expenses.
Invoice timing adds a cash dimension. A project can be profitable in the ledger and still leave you short of cash when the client pays late. QuickBooks reported that 59% of businesses had invoices overdue by 30 or more days in 2026, compared with 47% the prior year, and businesses with unpaid invoices were owed $17.7K on average. QuickBooks' late-payments report provides the source for those figures.
Ask these questions every month:
- Margin concentration: Which clients generate most of the margin, not most of the revenue?
- Deal drift: Which projects used more hours than the original estimate?
- Payment behavior: Which accounts repeatedly delay cash collection?
- Service mix: Which offers should you promote, redesign, or remove?
That analysis tells you where growth is worth pursuing.
A Step-by-Step Workflow to Run Profitability Analysis Each Month
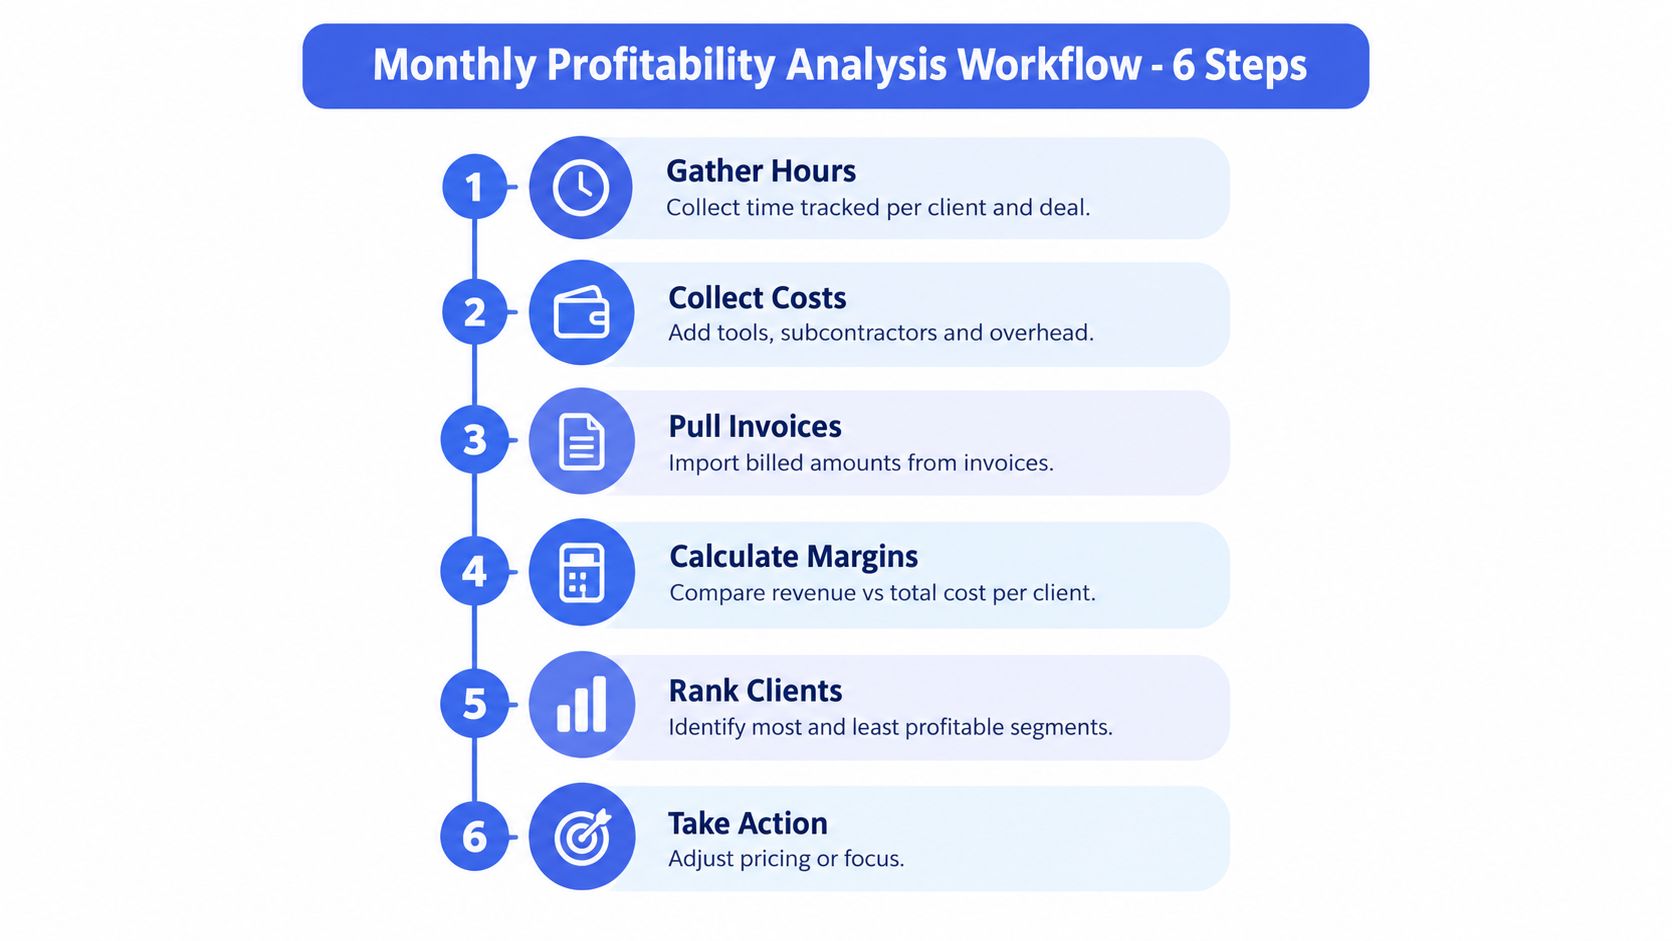
A monthly workflow works best when every input has a clear place. Set aside a half-day and treat each task as a focused block of roughly 30 to 60 minutes. The exact duration will vary, but the sequence keeps scattered data from turning into another abandoned spreadsheet.
Gather hours. Export time entries and assign every hour to a client and deal. Include sales calls, project management, revisions, and follow-ups. Unrecorded work makes profitable projects look better than they are.
Collect direct costs. Add subcontractor invoices, project-specific software, stock assets, delivery fees, travel, and other costs tied to the engagement. Keep recurring overhead separate so you can view both delivery margin and full business margin.
Pull invoices. List the previous month's billed revenue by client and deal. Mark each invoice as paid, due, or overdue. Billed revenue explains sales performance, while collection status explains liquidity.
Calculate margins. Subtract direct costs and time cost from client revenue. Calculate gross profit and contribution margin, then compare the result with your business breakeven.
Rank the work. Compare this month's result with the prior month and sort clients, services, and deals from strongest to weakest. Look for falling margin, rising hours, and repeated payment delays.
Take action. Flag any account below your target. Choose one response, such as repricing, narrowing scope, improving delivery, changing payment terms, or shifting the pipeline toward stronger work.
Your output should drive a short decision list:
- Reprice: Increase the fee where hours or direct costs consistently exceed the estimate.
- Redesign: Change the delivery process for a service that could become profitable with fewer manual steps.
- Stop or limit: Reduce work that consumes capacity without covering its cost.
- Change the mix: Spend more sales effort on clients and services with healthier contribution.
A lightweight CRM can make the collection step less dependent on memory. The value isn't the dashboard alone. It's the weekly discipline of assigning hours, costs, invoices, and follow-ups to the same client or deal.
This video provides another practical perspective on organizing profitability work:
Sample Calculations for Freelancers and Small Agencies
Worked examples make the formulas easier to use. The following cases use the figures specified for each scenario and show why a business should separate gross delivery economics from the full cost of doing the work.
A freelance designer
The designer invoices $7,500 in monthly revenue. Software and stock assets cost $1,200, subcontracted illustrator fees cost $600, and unrecovered administrative time is valued at $450.
Direct delivery costs equal $1,800. Gross profit is therefore $5,700, producing a gross margin of 76%. After including the $450 of unrecovered administration, the remaining profit is $5,250, producing a true margin of 70%.
The effective hourly rate requires total hours worked. The scenario doesn't provide a total, so don't invent one. Use this formula in your own books:
Effective hourly rate = true profit ÷ total hours worked
If the designer tracks taxes separately, the after-tax effective hourly rate is:
(true profit − taxes attributable to the work) ÷ total hours worked
The decision is clear even before the hourly figure exists. The designer should review whether the illustrator cost belongs in the quote, whether stock assets can be passed through to the client, and how much admin time should be protected or automated.
A small agency
The agency invoices $42,000 across three active clients. Direct labor is $18,000, tool and freelancer costs are $4,500, and late-payment fees caused by overdue invoices are $1,800.
Gross profit before late-payment fees is $19,500, which creates a gross margin of 46.4%. After the late-payment cost, profit falls to $17,700, or 42.1% of invoiced revenue. The agency should calculate the same lines separately for each client, because one account may create most of the overdue balance or consume disproportionate labor.
The required comparison also highlights a conflict in reported figures. A 15% overdue receivables balance can turn a reported 35% gross margin into a real 28% margin, according to the scenario. Treat those values as an analytical illustration, not a universal result. The practical response is to tighten collection follow-ups, change payment milestones, or reprice work for accounts that regularly delay payment.
| Line Item | Freelance Designer | Small Agency |
|---|---|---|
| Invoiced revenue | $7,500 | $42,000 |
| Software and stock assets | $1,200 | Included in tool and freelancer costs |
| Subcontracted or freelancer costs | $600 | Included in tool and freelancer costs |
| Direct labor or admin time | $450 admin time | $18,000 direct labor |
| Late-payment cost | Not provided | $1,800 |
| Profitability decision | Price delivery and admin correctly | Improve collections and compare clients |
For practical billing workflows, see this guide to invoicing as a freelancer. An invoice isn't complete evidence of profitability until you know when the cash arrives and what it cost to earn.
How Micro CRM Helps You Collect the Data for Profitability Analysis
A profitability model is only as useful as its inputs. A spreadsheet can hold the numbers, but it often separates client identity, deal status, invoices, messages, and appointments into disconnected tabs or applications. A lightweight system brings those records together so the owner can inspect one relationship or opportunity without reconstructing its history.
MicroCRM can serve that role for a freelancer or small team:
- Contacts and tags: Store the client identity, industry, service type, and segment tags. Those tags let you compare retained clients, one-off projects, or customer groups by revenue and delivery effort.
- Pipeline stages: Record deal value and expected close date in a visual Kanban pipeline. That gives you a place to compare expected opportunities with likely delivery cost before committing capacity.
- Invoicing: Create invoices, generate PDFs, send them by email, and track due dates and overdue status. Those fields help distinguish reported revenue from cash that has arrived.
- Email follow-ups: Templates and automated sequences reduce forgotten reminders. They also make recurring collection work easier to identify and account for as administrative time.
- Calendar: Appointments and availability records expose meetings and scheduling effort that freelancers often leave outside project costing.
- Reports: Revenue, deal, and activity KPIs can support a per-client view, while the product's service-business KPI view includes average project profitability based on revenue left after direct delivery costs and time.
The purpose isn't to replace accounting judgment. It is to reduce the manual effort required to connect operational activity with financial results. A CRM for freelancers should make the essential workflow easy enough to maintain every week.
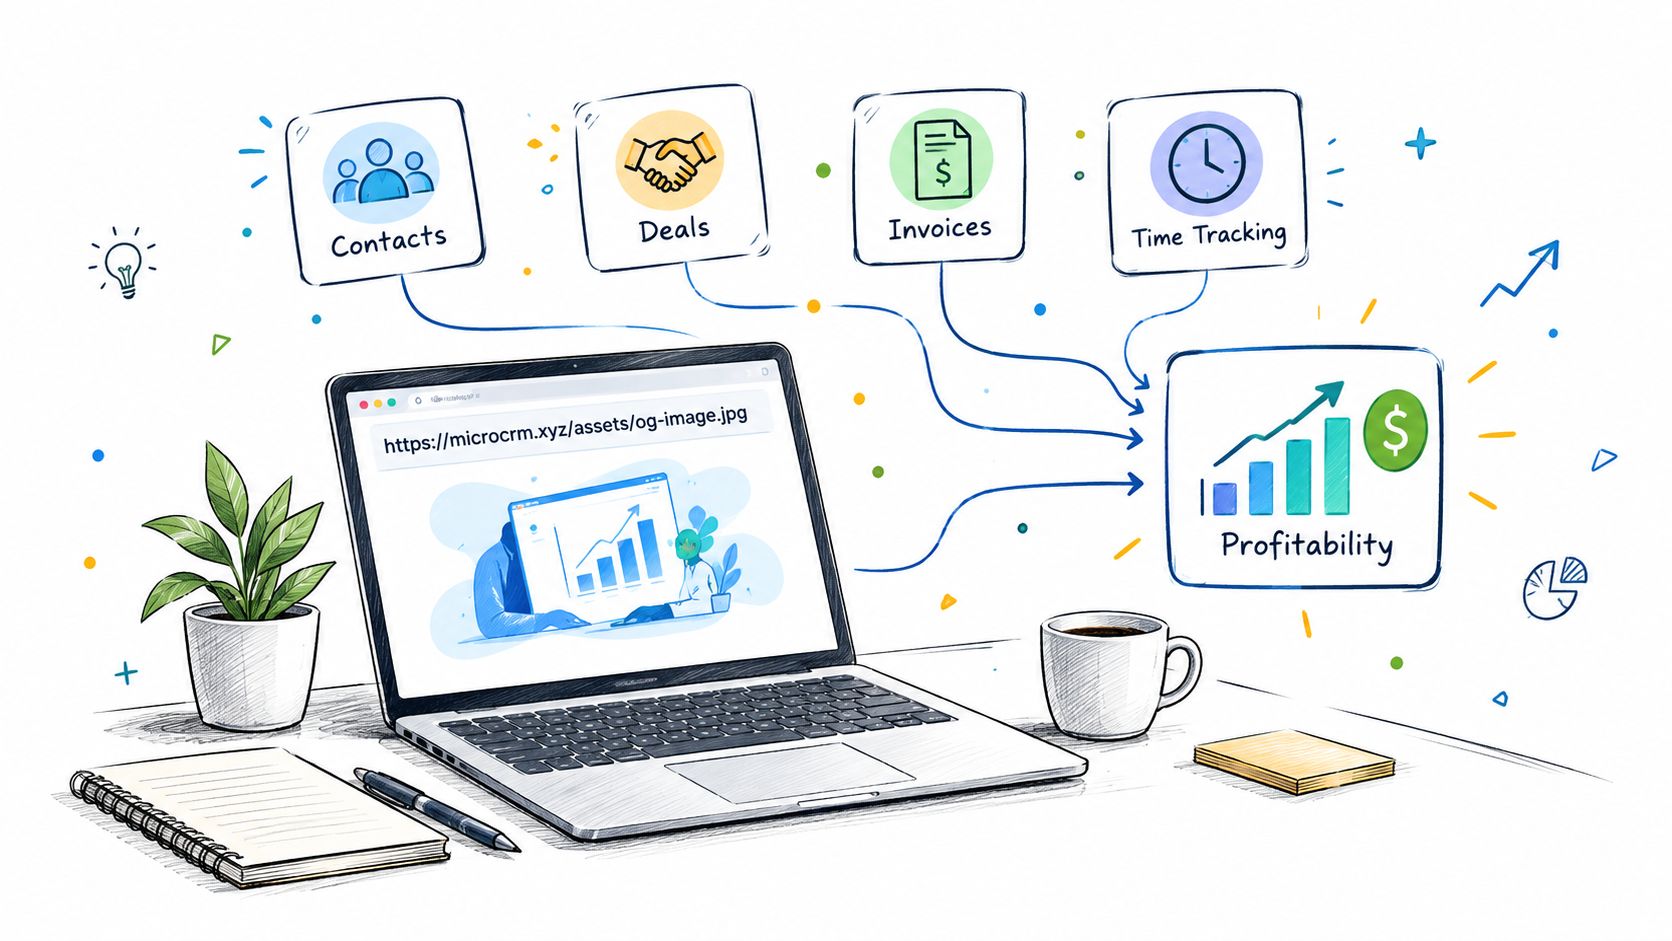
That combined view enables three concrete decisions. You can drop or limit an unprofitable client segment, reprice a service whose hours consistently exceed the estimate, or tighten payment terms where overdue invoices reduce realized margin. The benefit comes from acting on connected data, not from collecting more fields than the business can maintain.
Your 30-Day Profitability Analysis Plan and Next Steps
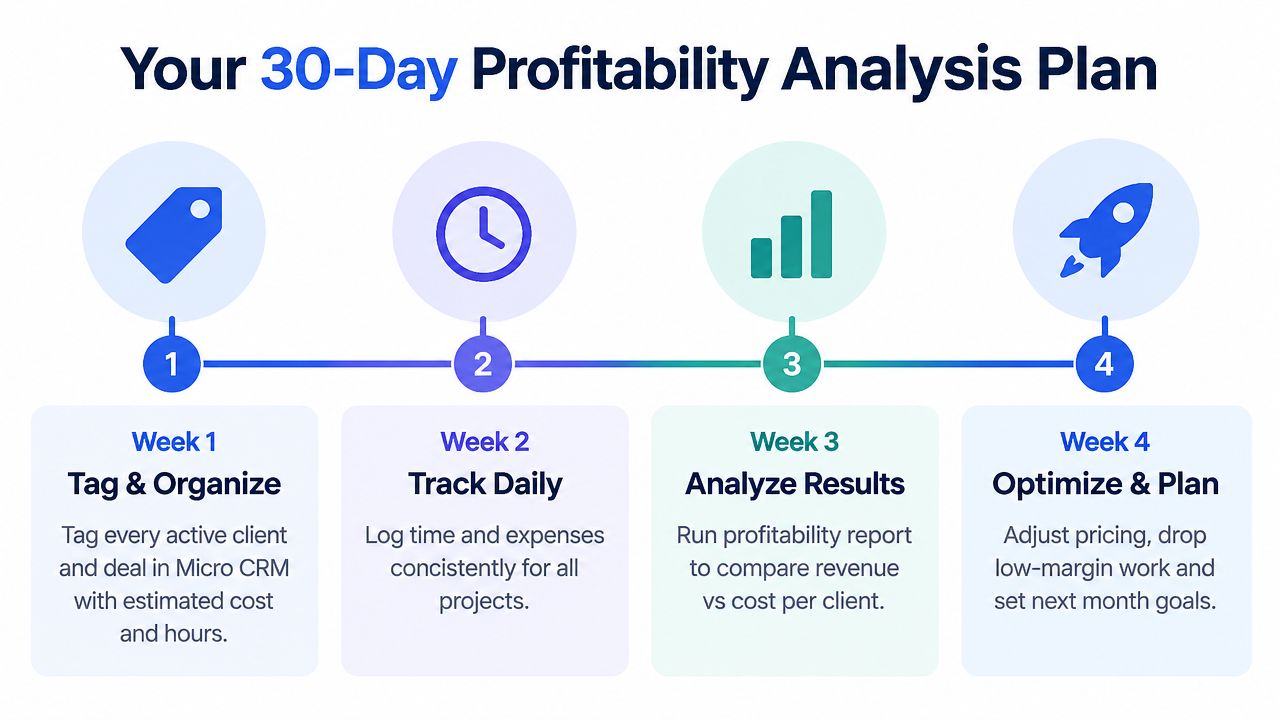
Use the next month to build the habit without redesigning your entire business.
Week 1, tag and organize: Add every active client and deal to your workspace. Record the service, estimated hours, expected revenue, and likely direct costs.
Week 2, track daily: Connect invoicing and log time and expenses against the correct deal. Include meetings, revisions, follow-ups, and subcontractor work.
Week 3, analyze results: Run the profitability view, compare client and service margins, and flag the lowest-performing group. Check whether weak results come from price, cost, scope, or payment timing.
Week 4, optimize and plan: Renegotiate underperforming contracts, reprice weak services, or stop work that doesn't justify its capacity cost. Set the next month's margin and collection targets.
Keep the review focused on three essentials: margin, cash realization, and return on the time and resources invested. Then move below the company average and inspect each client, deal, and service. Want to better organize your clients and business opportunities? Try MicroCRM for free, with no credit card required.
Manage clients, deals, and invoices in one platform with MicroCRM's simple contacts, Kanban pipeline, invoicing, follow-ups, calendar, and reporting tools. Use MicroCRM to connect the operational data behind your analysis of profitability and start for free, with no credit card required.