
Sales Metrics Dashboard for Freelancers: Build One in a Day
Monday starts with three browser tabs, a spreadsheet called Pipeline_FINAL_v3, and a Slack thread reminding you about a discovery call. You know money is moving, but you can't quickly answer which clients owe you, which prospects need a nudge, or whether next month's revenue is already covered.
That uncertainty usually isn't a motivation problem. It's a visibility problem. A practical sales metrics dashboard brings contacts, deals, invoices, activity, and follow-ups into one working view, so you can make decisions from recorded information instead of memory. For freelancers and small businesses, the aim isn't an enterprise analytics suite. It's a clear dashboard you can build and maintain in a day.
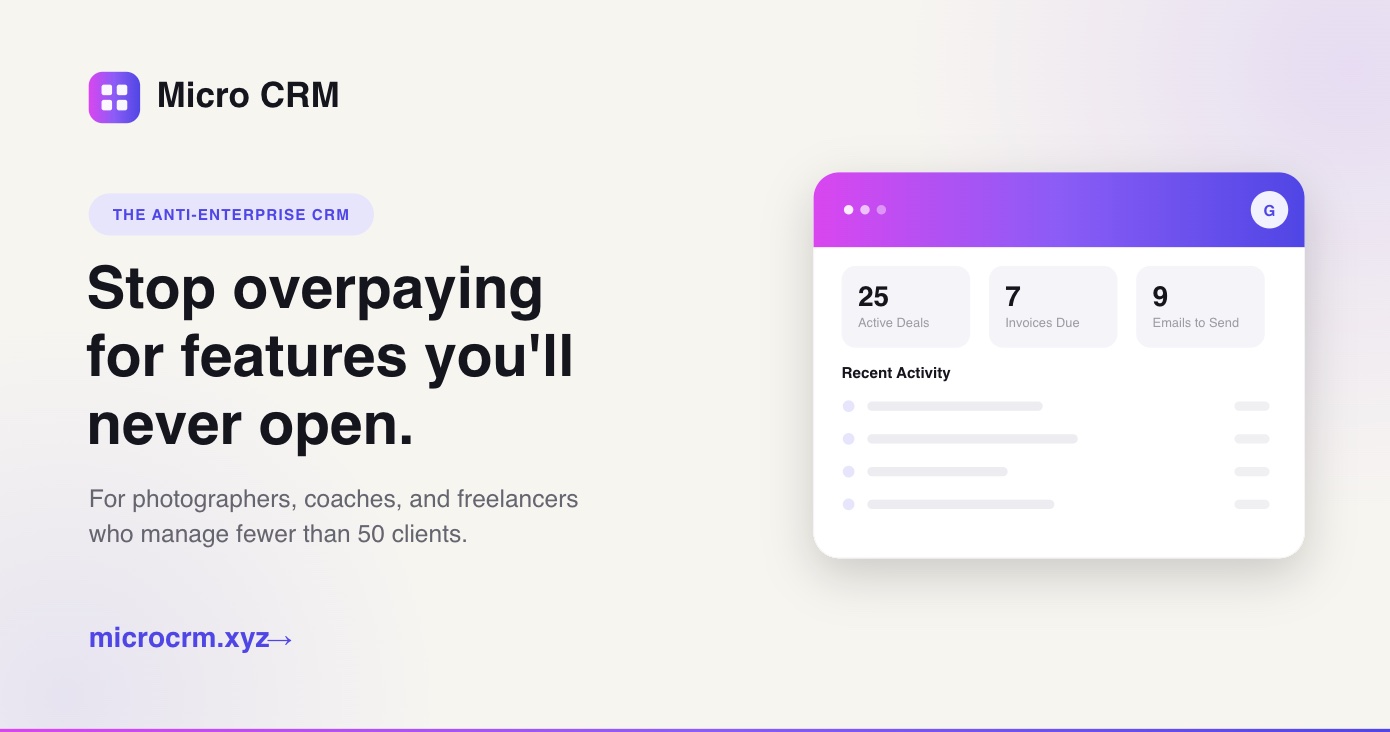
Table of Contents
- The Freelance Sales Pile-Up You Can See in a Dashboard
- Choosing the Right KPIs for a One-Person Sales Dashboard
- What a Lightweight CRM Dashboard Replaces in Your Spreadsheet
- Building the Dashboard Layout Step by Step
- Update Cadence, Benchmarks, and a Weekly Review Habit
- Putting It All Together in a Free CRM Workspace
The Freelance Sales Pile-Up You Can See in a Dashboard
By mid-morning, the spreadsheet has become a scavenger hunt. One tab contains prospective clients, another lists active projects, and an invoice total sits in a cell you entered weeks ago. Your next follow-up may be buried in email, while the details of a discovery call live in a calendar note.
The cost appears in small failures. You reply late to a promising inquiry. A proposal sits untouched because there's no task attached to it. You accept a low-fit project because you can't see which stronger opportunities are already close to a decision. Revenue feels fine, but the route to that revenue is unclear.
A dashboard turns those frustrations into visible signals:
- Follow-up age: Shows which prospects haven't received a recent touch.
- Stage distribution: Shows whether your opportunities are mostly new inquiries, proposals, or near-close deals.
- Expected close date: Shows what could contribute to this month's or next month's revenue.
- Outstanding invoices: Shows who owes you money after the deal has already been won.
- Tasks due: Shows what needs attention today, without searching through messages.
Practical rule: If a number doesn't change what you do next, it probably doesn't belong on the primary dashboard.
A useful sales pipeline management workflow gives you one screen for three questions: who owes me money, who needs a nudge, and where is this month heading? That screen doesn't eliminate uncertainty, but it makes uncertainty specific enough to act on.
The next decision is choosing KPIs that support those actions. A solo operator doesn't need a wall of charts. You need a small group of measures tied to real choices.
Choosing the Right KPIs for a One-Person Sales Dashboard
A solo operator can run a useful dashboard with three to five KPIs. Give each metric a decision to support. Too many numbers turn the main screen into a catalogue, so keep detailed diagnosis in drill-down views. SalesScreen's KPI guidance also supports exception-based reporting, which helps you focus on records needing attention instead of checking every deal manually.
Begin with coverage and win rate
Pipeline coverage shows whether your open opportunities can support the revenue target still ahead. Calculate it as:
Open pipeline value ÷ remaining revenue target
A common freelance target is 3x coverage, but that is only a starting point. Your trailing win rate gives a more relevant baseline, approximately 1 ÷ win rate. A business closing 25% of qualified opportunities needs about 4x coverage, while a 20% win rate implies 5x. Use the calculation to decide whether your pipeline contains enough potential revenue, not to chase an arbitrary ratio.
Win rate answers a separate question:
Closed-won opportunities ÷ closed opportunities
Break it down by deal size. If small projects close consistently but larger proposals do not, examine qualification, proof, pricing, or the offer itself. Coverage indicates whether you need more opportunities. Win rate shows whether your current opportunities are converting.
| KPI | What It Tells You | Solo-Operator Benchmark |
|---|---|---|
| Pipeline coverage | Whether open opportunities support the remaining target | Start around 3x, then adjust to your win rate |
| Win rate | Whether qualified opportunities become customers | Track your own trend, segmented by deal size |
| Lead-to-meeting rate | Whether inquiries become real conversations | Compare by lead source |
| Average deal size | Whether your offer mix supports the revenue goal | Use recent closed deals |
| Days to close | How long revenue takes to arrive | Use your actual recent cycle |
Track sales and invoices together through a focused revenue tracking workflow. That view helps you distinguish booked work from cash still due, a distinction a solo business cannot afford to lose. These numbers only become useful when your records can produce them.
What a Lightweight CRM Dashboard Replaces in Your Spreadsheet
Excel and Google Sheets are useful when the work is simple and the owner is disciplined. They become fragile when one file has to act as a contact database, pipeline, reminder system, invoice ledger, and reporting tool at the same time.
Common failure modes include duplicate entries, overwritten cells, accidental deletions, version confusion, and missing validation or audit trails. Guidance on moving client data beyond spreadsheets also notes that spreadsheets don't automatically record changes, reminders, or workflow history. That makes consistent client communication harder, while unsecured files can create data-protection risks under UK GDPR.
The operational issue is simple. A spreadsheet won't automatically create a task when you send a proposal or flag a valuable lead that has gone untouched. Every reminder depends on you checking the right row at the right time, a weakness also described in Bigin's explanation of spreadsheet limits.
| Task | Spreadsheet Reality | CRM Dashboard Reality |
|---|---|---|
| Store contacts | Names and notes spread across tabs | One contact record with interaction history |
| Track deal stage | Manual text edits can become inconsistent | Stage is attached to the deal record |
| Calculate revenue | Formulas can break after sorting or editing | Totals use current deal and invoice fields |
| Manage follow-ups | “Last Contacted” becomes stale | Tasks and reminders connect to the opportunity |
| Forecast | A typed total may be out of date | Expected value and close date update from records |
| Review activity | You search cells and messages | Activity and follow-up views surface exceptions |
A lightweight CRM doesn't make spreadsheets useless. It changes the fit. If you only track a few names and one-off jobs, a sheet may be enough. If you repeatedly miss next steps or can't trust the total on your dashboard, structured records are the better foundation.
The layout matters because the dashboard should expose the most important answers before you start clicking through individual deals.
Building the Dashboard Layout Step by Step
Build the page in three zones, arranged by the decisions you make most often. Keep every primary KPI tile above the fold, so the core view fits on a 13-inch laptop without scrolling.
Put money at the top
The top row should answer, “Where is money coming from?”
Use number tiles for absolute values:
- Revenue MTD, closed or invoiced revenue for the current month.
- MRR, where recurring subscriptions are part of your business model.
- Outstanding, invoices that have been issued but not paid.
Don't mix booked revenue, expected revenue, and cash received in one tile. Label each measure clearly. A won deal isn't the same as an invoice paid, and an invoice sent isn't the same as revenue collected.
Put pipeline in the middle
The middle row answers, “Where is money stuck or likely to arrive?”
Use a bar chart or funnel chart for deals by stage. A bar chart makes uneven stage distribution easy to spot, while a funnel emphasizes progression from inquiry to close. Add pipeline value, weighted forecast, win rate, average deal size, and days to close as supporting tiles or drill-down fields.
| Widget | Question It Answers | Data Field |
|---|---|---|
| Revenue MTD | What has been booked or invoiced this month? | Revenue date and amount |
| Pipeline Value | What open opportunity value remains? | Deal stage and value |
| Win Rate | How often do closed opportunities become wins? | Outcome and close date |
| Average Deal Size | What value does a typical win produce? | Closed-won amount |
| Days to Close | How long does revenue take to arrive? | Created date and close date |
| Follow-up Tasks | What needs action today? | Task due date and completion status |
Keep action at the bottom
The bottom row answers, “What needs attention today?”
Use a checklist widget for overdue follow-ups, proposals awaiting a response, calls to prepare for, and invoices requiring attention. Activity counters such as calls logged and proposals sent can help, but only if they lead to a decision. A high activity count without deal movement may indicate busywork, weak qualification, or poor offer fit.
Use line charts for revenue and pipeline trends over time. Use number tiles for absolutes, stage charts for distribution, and checklists for action. The dashboard should behave like a work surface, not a presentation slide.
Update Cadence, Benchmarks, and a Weekly Review Habit
A dashboard earns its place only when the records behind it stay current. Connect revenue and pipeline totals to the CRM, refresh them from active records, and review activity counters daily only when they change your outreach plan. Roll up win rate and average deal size weekly, using the same filters each time so comparisons remain useful.
Benchmarks should guide judgment rather than dictate it. Start with 3x pipeline coverage for the next month's revenue target, then adjust that working target using your trailing win rate. A 20% to 40% win rate may fit some price points, qualification standards, and offer types, but segmented history from your own business is more useful than a borrowed benchmark. Treat average close time the same way. Base it on completed deals, not an optimistic estimate that makes the forecast look healthier.

Set aside a 20-minute Friday review:
- Scan revenue reality: Check booked, invoiced, and outstanding amounts.
- Test next month's coverage: Compare open pipeline with the remaining target.
- Inspect stalled deals: Open two opportunities with old activity or missed close dates.
- Choose one experiment: Try a new subject line, revise a proposal opener, or tighten a follow-up sequence.
Record the decision and revisit it during the next review. This keeps a solo operator focused on one process change at a time, rather than rebuilding the dashboard whenever a deal slows down. The review creates a feedback loop that sharpens both your dashboard and your process.
Putting It All Together in a Free CRM Workspace
You can build this dashboard inside a lightweight CRM in an afternoon. The important work isn't choosing a fancy chart. It's preparing clean records that let each chart answer a real business question.
Start with contacts and active deals. Import the people you already know, then give each open deal a stage, value, expected close date, owner, and next action. For a solo business, the owner field may be obvious, but the next action isn't. “Follow up” is vague. “Send revised proposal” tells you exactly what to do.
Create three views:
- Deals by stage, to show where opportunities are accumulating.
- Revenue by month, to separate booked, invoiced, and expected revenue.
- Follow-up tasks, to expose overdue or missing next steps.
Then pin the views as dashboard widgets. Connect web-form inquiries, email replies, appointment bookings, and invoice payments where your tools support those integrations. A booking workflow can send an immediate confirmation, a 24-hour-before reminder, and a 2-hour-before reminder, followed by same-day thanks, a 24-48 hour review request, a 1-week check-in, and a 30-day rebooking reminder, according to this CRM-connected appointment workflow guide. Those timing rules turn a calendar event into a lead and client workflow.
For a simpler starting point, Micro CRM's small-business CRM guide reflects the practical requirement: contacts, deals, invoices, email follow-ups, appointments, and reporting should live together without a long implementation project. Micro CRM offers contact management, a Kanban pipeline, invoicing, email sequences, calendar scheduling, and KPI reporting in one workspace, with a free plan that doesn't require a credit card.
Validate the dashboard against one full week of real activity. If you never check a widget, remove it. If a missing field keeps blocking a decision, add it. The workspace should grow with your business, not force you to rebuild your process every quarter.
Manage clients, deals, and invoices in one platform with Micro CRM's focused workspace for contacts, pipeline, invoicing, follow-ups, and appointments. Visit Micro CRM to build a practical sales metrics dashboard without unnecessary CRM complexity. Start for free, with no credit card required.