Reports in CRM: A Practical Guide for Small Businesses
Monday morning starts with a spreadsheet that was updated halfway, sticky notes for follow-ups, and an inbox full of quoted prices. You know several clients are considering proposals, but you can't quickly answer the question that matters most this week: should you focus on closing older deals, pitch new work, or chase unpaid invoices?

Reports in CRM should make that decision easier. They bring contacts, deals, activities, and invoices into a few readable views, so you can see what needs attention instead of reconstructing the story from separate files. This guide focuses on the three reports that change a small business owner's week: revenue, pipeline, and activity.
Table of Contents
- When Spreadsheets Stop Telling You the Truth
- What CRM Reports Actually Are
- Revenue Reports You Can Trust
- Reading Your Deal Pipeline Like a Forecast
- Activity KPIs That Change Your Week
- A Quick Example With MicroCRM
- Adding Uncertainty to Pipeline Forecasts
- Three Reporting Habits Worth Keeping
When Spreadsheets Stop Telling You the Truth
A spreadsheet can hold a surprising amount of information. It can list a prospect, proposal amount, expected close date, and next action. The trouble starts when that information lives in several places and nobody updates each place consistently.
A photographer might keep leads in Excel, proposals in a document folder, invoice status in accounting software, and client conversations in email. A small design studio may add a note to a shared sheet after a call, then forget to record the follow-up date. The data exists, but the operational story has disappeared.
Practical rule: If answering a basic sales question requires opening several apps, your reporting system is already costing you time.
Excel and shared documents are useful for simple lists. They don't naturally show whether a deal has gone quiet, whether a proposal is stuck, or whether booked work has turned into collected cash. A small-business sales tracker can keep the underlying records together, but the report still needs to answer a decision rather than display activity for its own sake.
For a freelancer, that means three useful views. A revenue report separates what you've booked, invoiced, and collected. A pipeline report shows which opportunities are active, aging, or stalled. An activity report identifies follow-ups, meetings, and tasks that require action.
MicroCRM is a practical example of this lightweight approach. It combines contact and deal management, a visual pipeline, invoicing, email follow-ups, and calendar activity without requiring a complex enterprise setup. The value isn't the number of widgets on the screen. It's the answer you can act on before lunch.
What CRM Reports Actually Are
A CRM report is a structured view of customer records that answers a specific business question. It may combine a contact, an opportunity, an email, a task, and an invoice, then turn those records into a trend, total, list, or chart.
That doesn't mean every CRM report needs to be a large dashboard. Most freelancers and small businesses need a small group of recurring views that support weekly decisions. A report that nobody checks, or that contains numbers nobody trusts, is decoration.
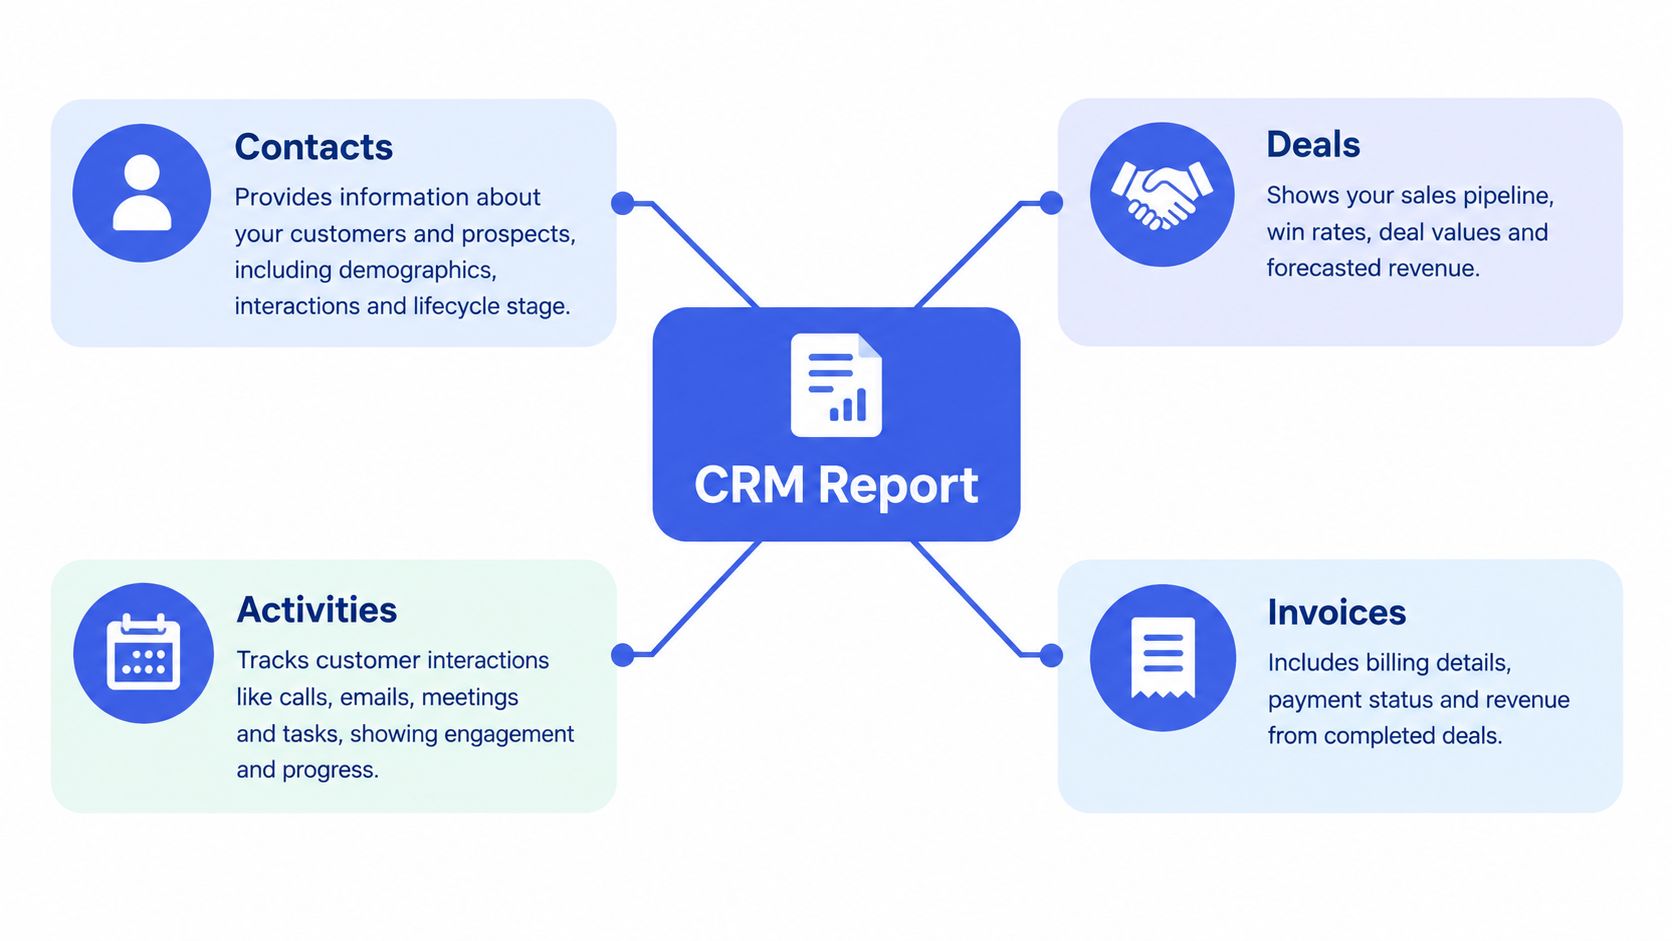
CRM reporting usually draws from four operational records:
- Contacts: People and companies, including their history and relationship details.
- Deals: Opportunities, stages, values, and expected outcomes.
- Activities: Emails, calls, meetings, tasks, and follow-up dates.
- Invoices: Amounts issued, payment status, terms, and outstanding balances.
Those records become management indicators. Revenue, conversion, pipeline value, and retention aren't usually entered as isolated facts. They're calculated from the records underneath. That means clean dates, correct deal stages, current contact details, and consistent activity logging matter more than flashy charts.
| Report family | Question it answers | Typical data sources |
|---|---|---|
| Revenue | Is booked work becoming invoices and cash? | Deals, invoices, payment status |
| Deal pipeline | Which opportunities could become future work? | Deals, stages, values, close dates |
| Activity KPIs | Who needs attention and what work is pending? | Emails, calls, meetings, tasks |
CRM developed from computerized sales-force management in the 1970s, then expanded through relationship marketing in the 1980s and early 1990s before gaining momentum as a broader management idea in the mid-to-late 1990s, as described in this scholarly review of CRM development. For a micro-business, the lesson is simple: reporting should convert accumulated records into decisions about follow-up, revenue, and workload, not imitate an enterprise analytics department.
Revenue Reports You Can Trust
Start with the question most owners ask: how much did I make this month? Then improve the question. How much work was booked, how much was invoiced, and how much cash arrived?
Those aren't interchangeable numbers. A won deal may represent future work. An invoice shows that you've billed for work. Collected cash confirms that the money reached your business. Combining all three into one revenue total can make a healthy pipeline look like healthy liquidity when the bank balance tells a different story.
Consider a photographer with three wedding bookings. Two clients have received invoices, and one of those invoices is still awaiting payment. The bookings indicate future revenue, the invoices show billing activity, and the collected amount shows available cash. A report that labels all three bookings as current revenue hides the collection problem.
Research from Intuit QuickBooks on late small-business payments found that 56% of 2,487 surveyed U.S. small businesses were owed money from unpaid invoices, with an average outstanding balance exceeding $17,000. The report also found that 47% had invoices more than 30 days overdue. These figures explain why a pipeline can look strong while the owner still struggles to fund operating costs.
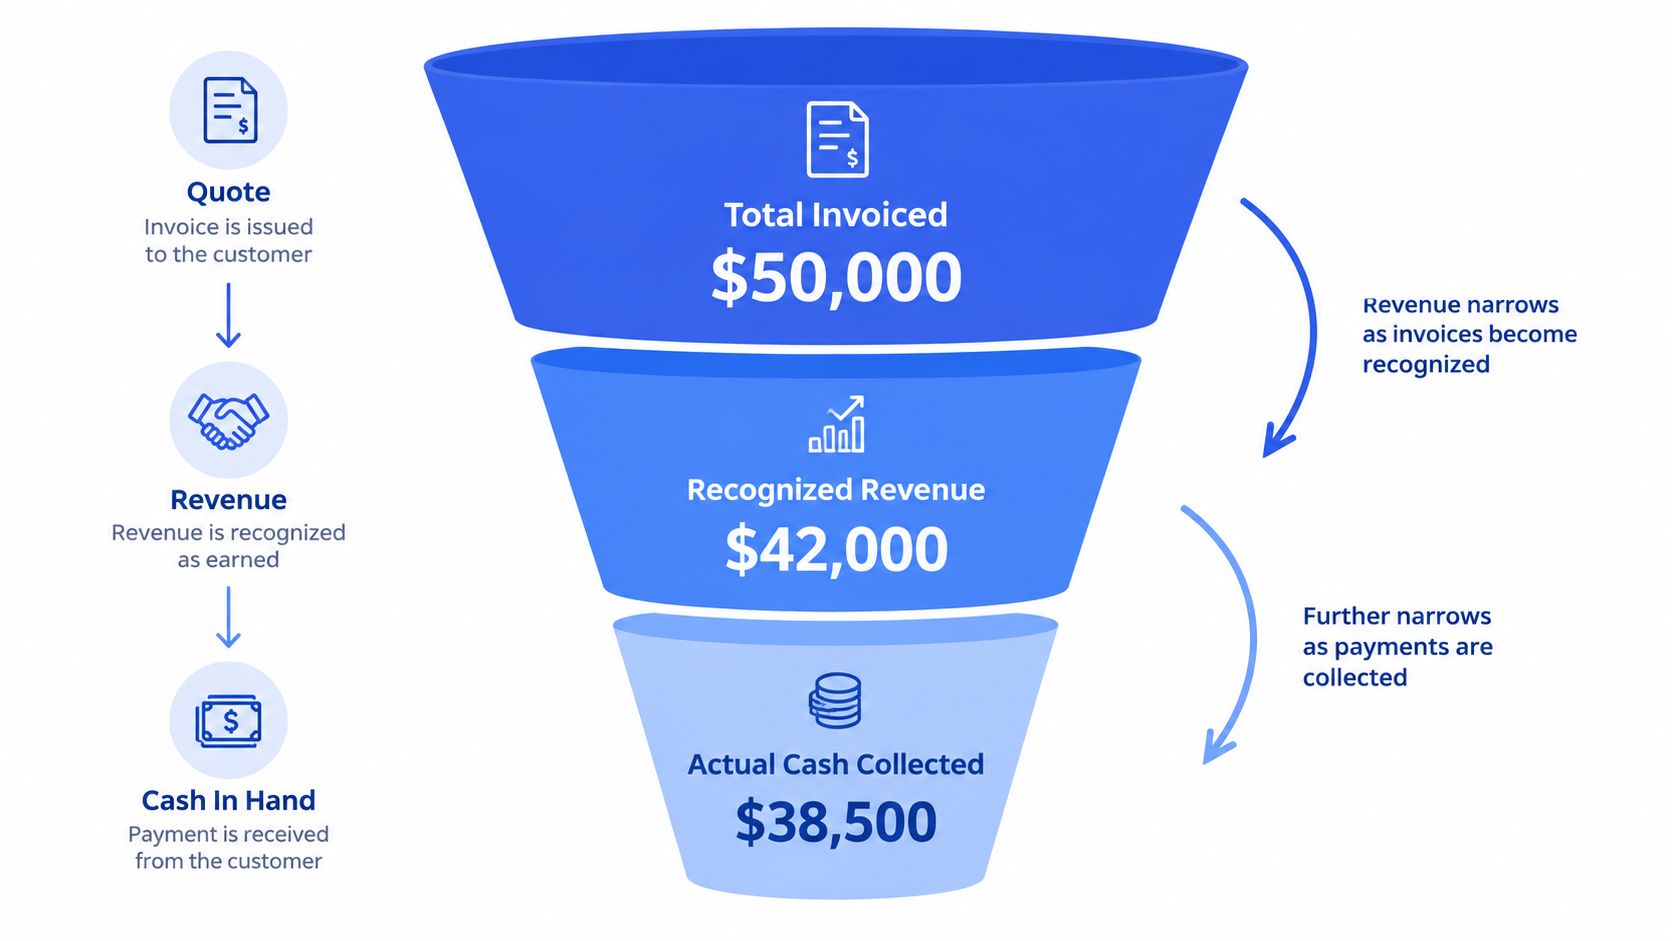
A useful weekly revenue report should show:
- Booked value: Deals marked as won or scheduled for delivery.
- Invoiced value: Work billed during the period.
- Collected cash: Payments received.
- Overdue balance: Invoices that remain unpaid.
- Collection lag: How long billed work takes to become cash.
Payment terms deserve their own field. A 2026 QuickBooks report on payment terms and overdue invoices found overdue invoices among 55% of businesses using net-30 terms, compared with 26% of businesses requiring immediate payment. Immediate payment won't suit every client or project, but a report should make terms and aging visible.
Check invoices by status, including current, under 30 days overdue, and over 30 days overdue. That view tells you whether to send a routine reminder, make a direct collection call, or reconsider scheduling additional work for a client with a growing balance.
Reading Your Deal Pipeline Like a Forecast
A pipeline report shows the work that might happen next. In a visual Kanban pipeline, opportunities move from a new lead through stages such as discovery, proposal, negotiation, and closed won. The layout is useful because it shows both deal volume and location, but the headline total shouldn't become a promise.
Many CRMs apply a probability to each stage and calculate a weighted forecast. That can help compare opportunities, especially when several deals have different levels of commitment. It becomes misleading when the probabilities are treated as measured facts rather than assumptions.
Look at the signals beside the weighted value:
- Deal age: How long has the opportunity existed?
- Stage age: How long has it remained in its current position?
- Recent activity: Has anyone emailed, called, or met with the prospect?
- Next step: Is a specific action and date recorded?
- Data quality: Are the contact, amount, and expected close date current?
Suppose three deals produce the same weighted pipeline total. One version contains three recently qualified proposals, each with a scheduled next step. Another contains one new proposal and two opportunities that haven't moved for weeks. The total is identical, but the second forecast carries much more risk.
A Kanban view helps you see that difference quickly. A guide to sales pipeline management is useful for defining stages, but reporting should go further by showing inactivity and age alongside stage labels.
A forecast is most useful when it tells you which assumption to test next.
Use the pipeline report to decide whether to follow up, revise a close date, remove a stale opportunity, or create capacity for new work. It shouldn't decide your week automatically. The owner still needs to investigate the deals behind the number.
Activity KPIs That Change Your Week
Revenue and pipeline reports describe outcomes and possibilities. Activity KPIs show the behavior that can change those outcomes. For a small business, the most useful activity view often looks less like an executive dashboard and more like a Monday task list.
Compare two records for the same proposal. In a spreadsheet, you may see the client name, value, and stage. In a CRM activity view, you can also see the last email, scheduled meeting, open task, and next follow-up. The second view gives you something to do.
Start with these practical filters:
- Follow-ups due today: Work that should happen before the opportunity goes cold.
- No recent activity: Deals without a recent email, call, or meeting.
- Missing next step: Opportunities that have a stage but no defined action.
- Outreach volume: Emails, calls, meetings, and completed tasks over time.
A consultant might open the report and find five deals with no email in the last 14 days. That isn't an abstract productivity score. It's a concrete Monday morning list. The consultant can review each opportunity, send a relevant message, schedule a call, or close the record if the work is no longer realistic.
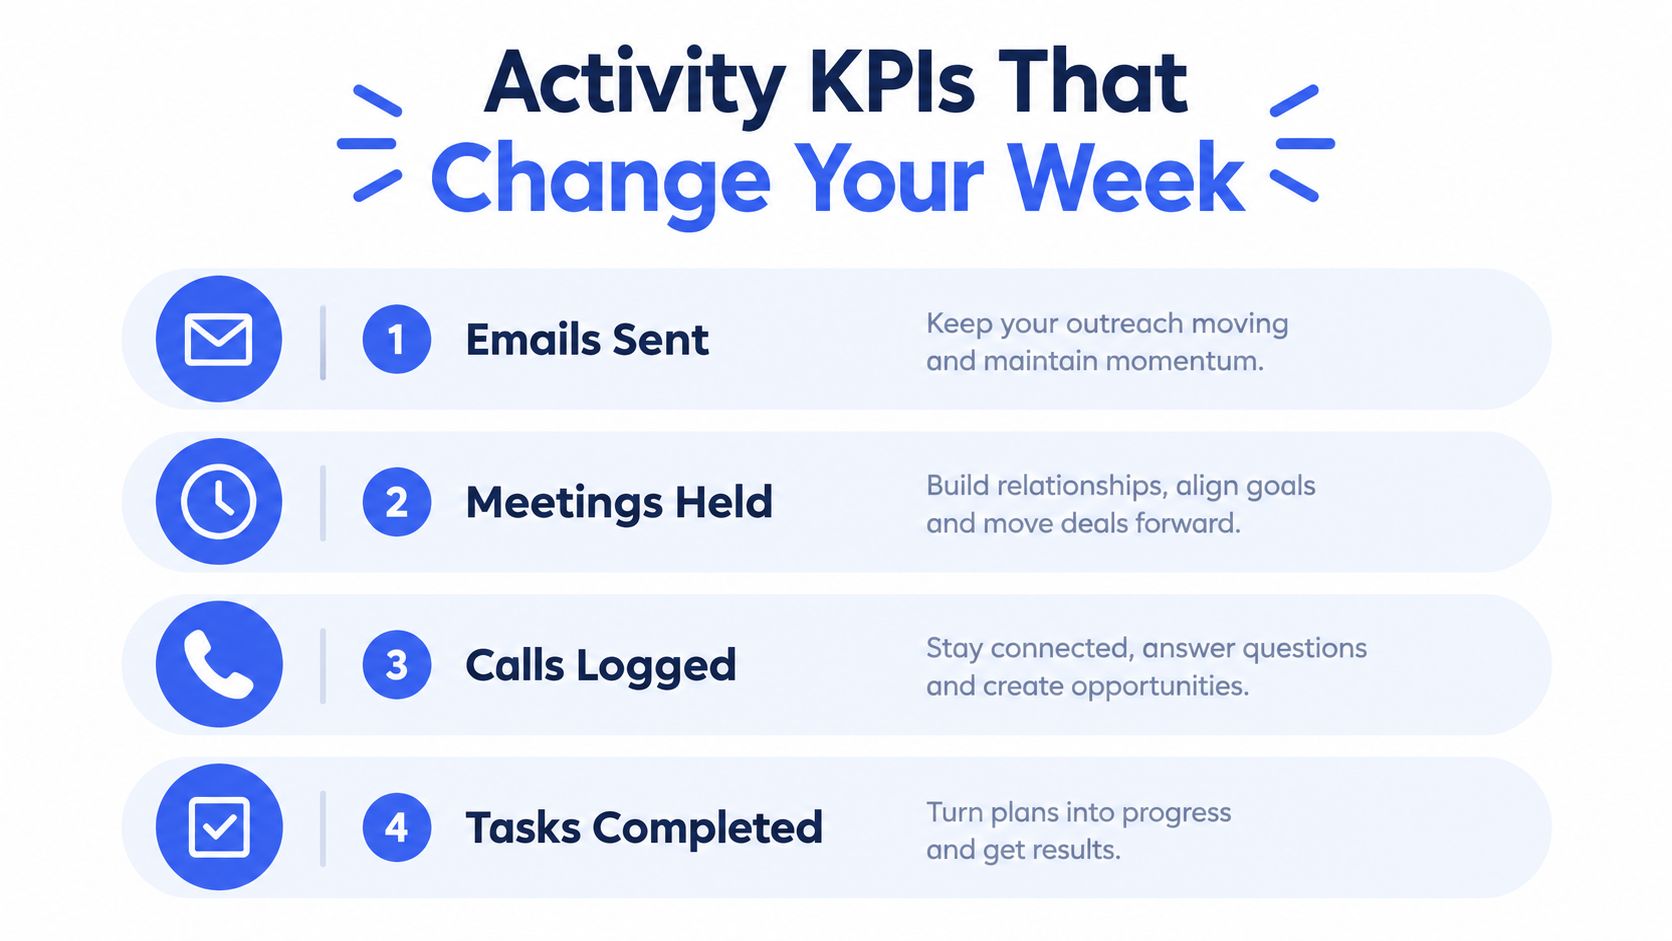
Follow-up cadence is measurable, and it can affect engagement. An analysis of 12 million emails and follow-up responses reported that one follow-up email increased reply rates by 65.8%, while the first follow-up was associated with increases ranging from 40% to 49%. That doesn't mean every prospect will respond, but it supports tracking whether a follow-up happened instead of relying on memory.
Activity KPIs work as leading indicators. Pipeline and revenue tell you what has already happened or what may happen. Activity reporting tells you where your behavior is currently creating, preserving, or losing momentum.
A Quick Example With MicroCRM
A solo designer can turn these reports into a short Monday routine. First, the designer checks the revenue view for the past 30 days and separates invoices issued from payments collected. That immediately answers whether recent work is producing cash or only increasing receivables.
Next comes the Kanban pipeline. Deals sitting in the proposal stage receive a closer look, especially when their expected close date has passed or no next action is recorded. The designer can move a deal, update its probability, revise the value, or send a follow-up without rebuilding the pipeline in another file.
The final check is activity. Follow-ups due, appointments, and opportunities without a recent touch appear together, turning a vague concern about sales into a manageable list of actions.
MicroCRM brings these functions into one workspace. Its centralized contact and deal management keeps interaction history attached to the client. Its visual Kanban pipeline supports drag-and-drop stages and probability calculations. Its invoicing tools create PDFs, send invoices by email, and support multi-currency billing.
The reporting routine maps directly to the three weekly decisions:
| Weekly decision | Report view | Action |
|---|---|---|
| Who should I follow up with? | Activity and contact history | Send an email, schedule a call, or set a task |
| Should I start new work? | Pipeline age and stage view | Clear stalled deals or protect delivery capacity |
| Is cash keeping up with booked deals? | Revenue and invoice status | Follow up on overdue balances or adjust timing |
Email templates, variable placeholders, and automated email sequences can support consistent outreach. The appointment calendar helps keep meetings and availability visible. You can review the MicroCRM workspace to see how these records are organized without adding separate tools for every step.
The point isn't to automate judgment. It's to remove the repeated search through inboxes, documents, and billing records before you make that judgment.
Adding Uncertainty to Pipeline Forecasts
Weighted pipeline totals are useful starting hypotheses. They aren't cash in the bank, and they aren't reliable just because a CRM displays them with a decimal or percentage.
The problem is sharper for small firms with limited history. An industry report cited in this discussion of CRM adoption and uncertainty-aware forecasting places adoption among the smallest firms as low as 26% to 50%, which means many businesses may have incomplete records or too little history to validate stage probabilities.
Add uncertainty cues directly to the report:
- Show a base-case range: Use a conservative and an optimistic view rather than one precise outcome.
- Display deal age: A new opportunity and a long-running opportunity shouldn't look equally healthy.
- Flag missing next steps: Treat missing actions as a data-quality warning.
- Warn about inactive contacts: A deal without recent contact deserves review before it enters a confident forecast.
Three fresh proposals at the same stage may represent a credible workload if each has a current contact and scheduled next action. One fresh proposal plus two stale deals may show the same weighted total but require very different planning.
Stage probability is an assumption unless your own historical outcomes support it. Reports become more honest when they pair probability with age, activity, and record quality, rather than presenting a single forecast number as certainty.
Three Reporting Habits Worth Keeping
The first habit is to read revenue as a chain. Start with booked work, then check invoices issued, cash collected, and overdue balances. A monthly total is convenient, but the chain tells you which financial action belongs next.
The second habit is to question the weighted pipeline total. Check deal age, time in stage, recent activity, and next steps before deciding whether you can safely start new work. A large number built from stale opportunities can create more scheduling risk than a smaller, well-supported pipeline.
The third habit is to keep activity KPIs visible on Monday morning. Follow-ups due, deals without recent contact, and missing tasks should form a working list, not disappear inside a dashboard. Consistent reporting makes the next action easier to see.
For freelancers and small businesses, the best reports aren't the most elaborate. They're the ones that help you choose who to contact, what work to accept, and whether your revenue is becoming cash.
MicroCRM brings contacts, deals, invoices, follow-ups, appointments, and practical reports into one lightweight workspace. Visit Micro CRM to put these three reporting habits into practice with the free plan, with no credit card required.